'%3e%3cg%20transform='translate(76.124%2037.922)'%20style='isolation:isolate'%3e%3cpath%20d='M21.985-77.7l-5.958,8.856L10.07-77.7H7.77v16.1h2.3V-73.445l5.543,8.166h.828l5.543-8.166V-61.6h2.3V-77.7Zm9.408,4.163a7.286,7.286,0,0,0-4.9,1.817l1.472,1.127a5.462,5.462,0,0,1,3.013-1.035c2.415,0,2.783,1.38,2.783,3.151H31.876c-1.633,0-6.073.092-6.073,3.749,0,2.093,1.932,3.427,4.14,3.427a4.564,4.564,0,0,0,3.818-1.909v1.61h2.093v-7.039C35.855-71.42,34.751-73.537,31.393-73.537Zm2.369,8.6A3.655,3.655,0,0,1,30.4-63c-1.863,0-2.438-.92-2.438-1.817,0-2.047,2.829-2.024,4.991-2.024h.805Zm9.891-8.6a4.157,4.157,0,0,0-3.611,1.909v-1.633H37.949V-61.6h2.093v-6.694a3.131,3.131,0,0,1,3.105-3.266c2.185,0,2.875,1.633,2.875,3.266V-61.6h2.093V-68.89A4.521,4.521,0,0,0,43.653-73.537Zm11.869,2.277v-2H52.831V-75.7H50.738v2.438H48.921v2h1.817v5.866c0,2.553,1.127,3.91,3.657,3.91a5,5,0,0,0,1.127-.115v-1.84c-.253.023-.506.046-.851.046-1.817,0-1.84-1.1-1.84-2.76v-5.106Zm6.648-2.277a7.286,7.286,0,0,0-4.9,1.817l1.472,1.127a5.462,5.462,0,0,1,3.013-1.035c2.415,0,2.783,1.38,2.783,3.151H62.653c-1.633,0-6.073.092-6.073,3.749,0,2.093,1.932,3.427,4.14,3.427a4.564,4.564,0,0,0,3.818-1.909v1.61h2.093v-7.039C66.632-71.42,65.528-73.537,62.17-73.537Zm2.369,8.6A3.655,3.655,0,0,1,61.181-63c-1.863,0-2.438-.92-2.438-1.817,0-2.047,2.829-2.024,4.991-2.024h.805ZM68.725-77.7v16.1h2.093V-77.7Zm12.237,4.439-3.2,8.419-3.588-8.419H71.854L76.73-62.2l-2.07,5.037h2.254l6.372-16.1Zm7.361,4.9c-1.334-.276-2.944-.368-2.944-1.679,0-.966.851-1.61,2-1.61a2.137,2.137,0,0,1,2.208,1.334l1.955-.529a3.832,3.832,0,0,0-3.979-2.691c-2.53,0-4.3,1.518-4.3,3.657,0,1.725.943,2.783,3.128,3.266,1.61.368,3.565.368,3.565,1.725,0,1.035-.851,1.656-2.369,1.656-1.886,0-2.507-.828-2.691-1.426l-2.047.69c.46,1.748,2.392,2.668,4.692,2.668,3.105,0,4.577-1.725,4.577-3.8C92.118-66.843,91.175-67.763,88.323-68.361Z'%20transform='translate(-7.77%2077.7)'%20fill='%23efefef'/%3e%3c/g%3e%3cg%20transform='translate(37.428%2032.714)'%3e%3cg%20transform='translate(0%200)'%20clip-path='url(%23a)'%3e%3cpath%20d='M27.251,14.507,22.633,3.938A7.662,7.662,0,0,0,15.938,0H0L6.428,6.428a2.865,2.865,0,0,0,2.026.839h8.092A7.443,7.443,0,0,1,21.56,9.209Z'%20transform='translate(0%200)'%20fill='%23fcc45c'/%3e%3cpath%20d='M99.681,168.129l-5.915-5.5a5.363,5.363,0,0,0-5.4-.659l-10.231,4.449,5.921,2.332a2.005,2.005,0,0,0,1.535-.027l5.195-2.259a5.21,5.21,0,0,1,3.761-.153Z'%20transform='translate(-73.605%20-152.158)'%20fill='%23fcc45c'/%3e%3cpath%20d='M202.96,271.253l-5.331-1.877a3.754,3.754,0,0,0-3.649,1.084l-5.326,5.711,4.452-.155a1.4,1.4,0,0,0,.978-.446l2.7-2.9a3.647,3.647,0,0,1,2.371-1.148Z'%20transform='translate(-177.709%20-253.644)'%20fill='%23fcc45c'/%3e%3cpath%20d='M311.272,336.306l-3.946.283a2.628,2.628,0,0,0-2.04,1.714l-1.825,5.153,2.815-1.342a.982.982,0,0,0,.5-.559l.927-2.616a2.553,2.553,0,0,1,1.2-1.4Z'%20transform='translate(-285.855%20-316.795)'%20fill='%23fcc45c'/%3e%3c/g%3e%3c/g%3e%3c/g%3e%3c/svg%3e)
Smarter Analysis With

Unlock new insights with our flagship software for multiplex single-cell and spatial phenotyping


Discover Our Software
In-Depth Insights
Single-cell and spatial phenotyping pipelines that allow you to go beyond the surface
Speed & Precision
Streamlined analysis pipelines built to deliver accurate and trustworthy results
Scalability
Flexible workflow that accommodates projects from lowplex to highplex, and small cohorts to large studies
Traceability
Automatically generated analysis reports that provide a precise, reproducible paper trail
Guided Workflow
Step-by-step guidance, easy-to-use tools, and an intuitive no code interface
Local & Secure
Locally run software on your own device, which keeps data private, secure, and fully under your control
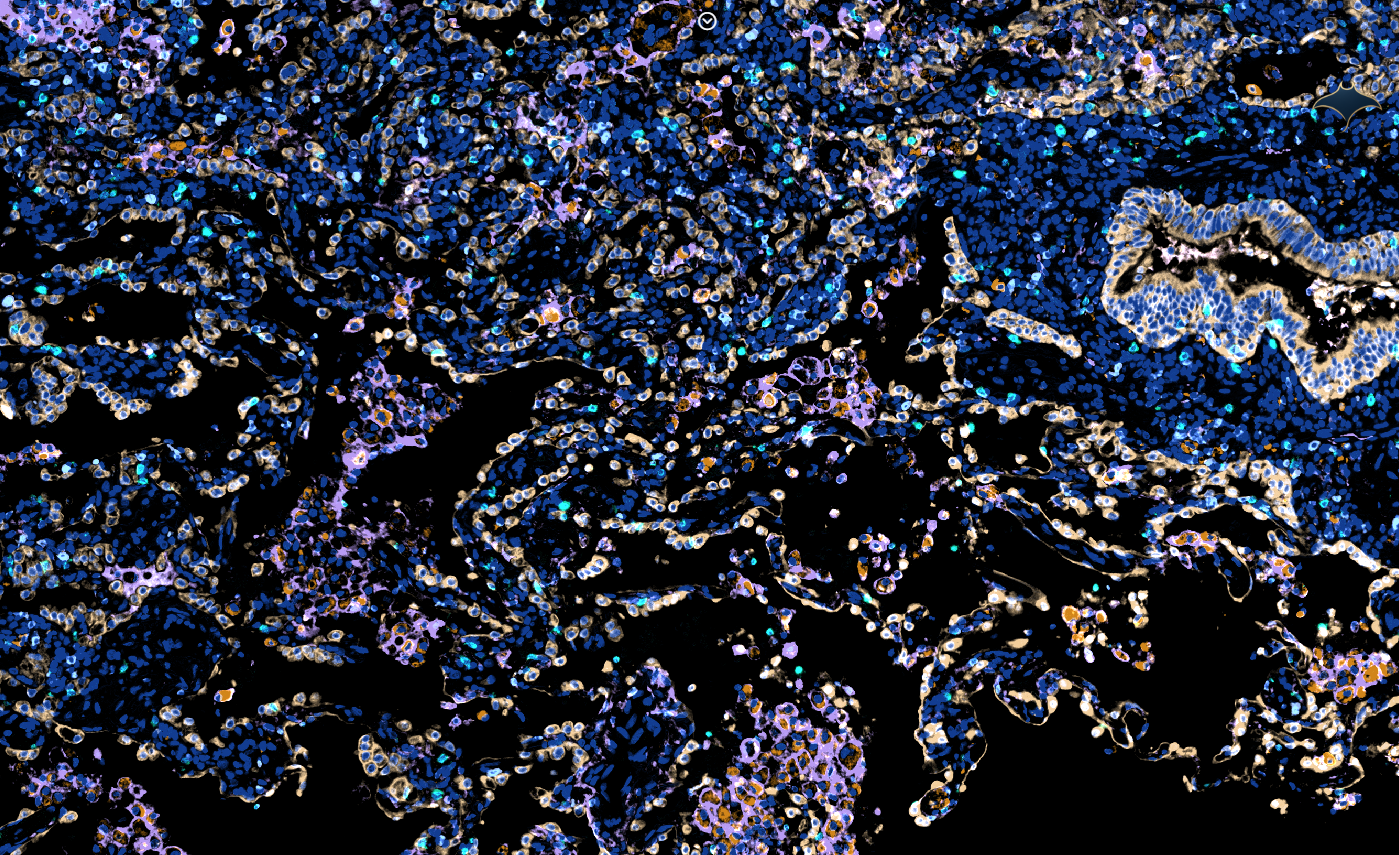
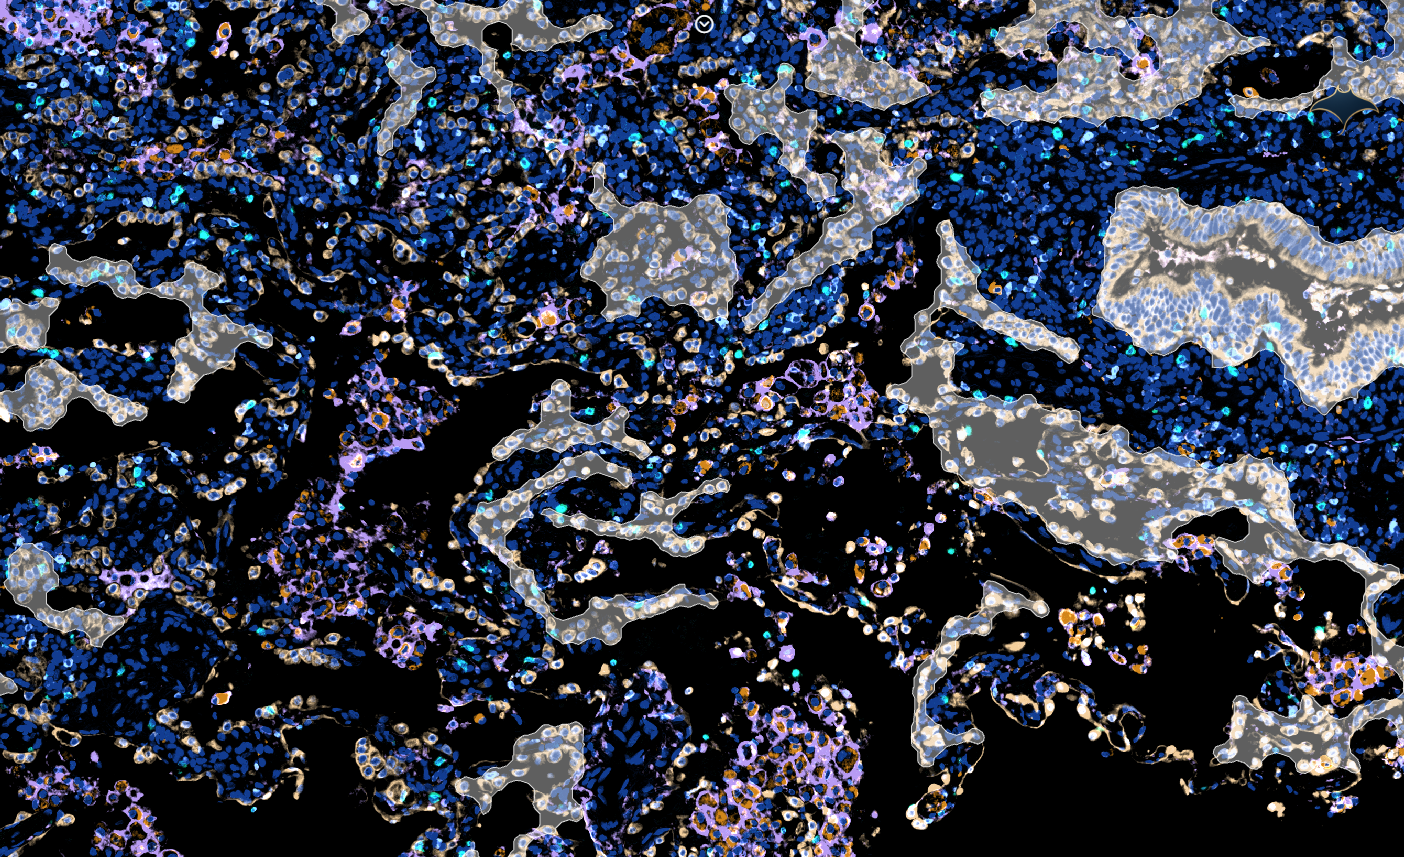
Automated Tissue Handling
Seamless handling and quality control for whole-slide images
- Preview, create, and edit tissue masks with our intuitive AI-powered toolkit
- Detect holes, rips, and tears in the tissue with accuracy, reproducibility, and speed
- Streamline quality control with the automated exclusion of artifacts such as tissue folds, out-of-focus regions, and debris
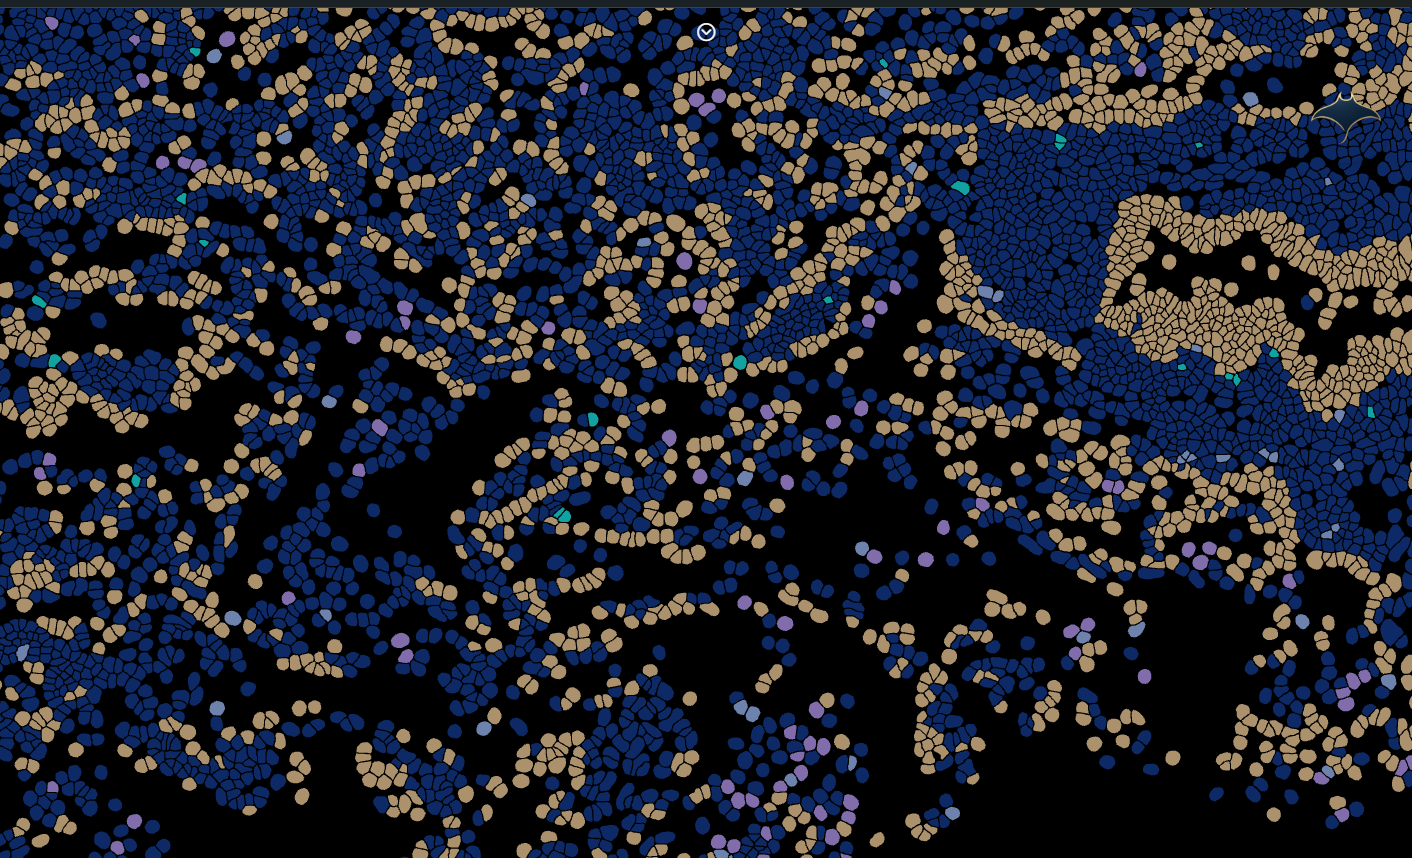
Multiplex Tissue Visualization
Intuitive toolbox to set up your analysis for success
- Explore your tissue and annotate regions of interest
- Create customized structures with concentric inner or outer layers
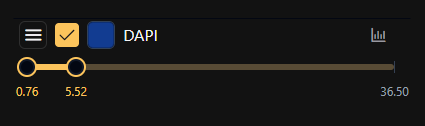
- Optimize channel parameters manually or with automatic thresholding
- Assess staining of individual biomarkers using Grid View mode
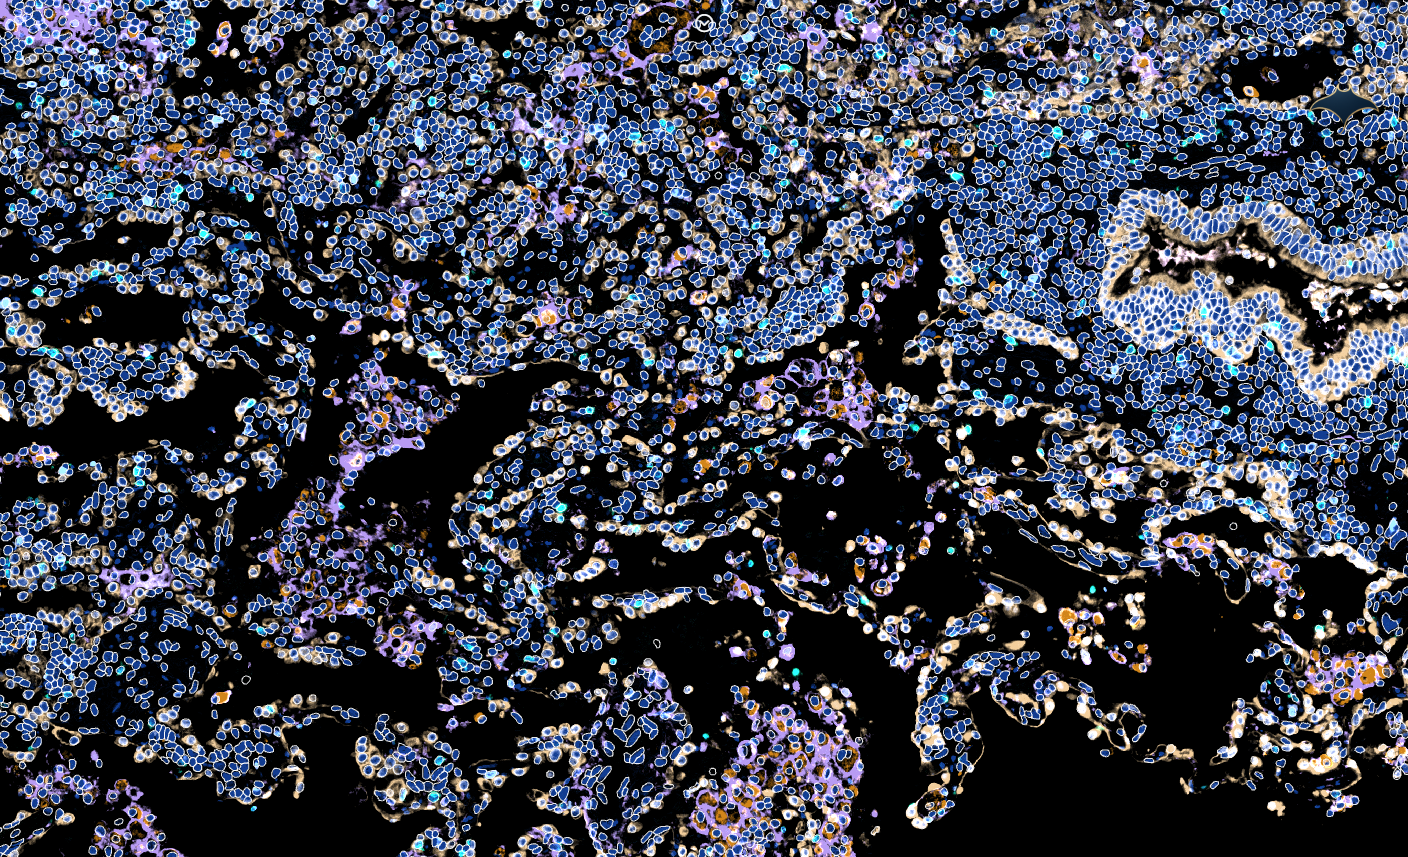
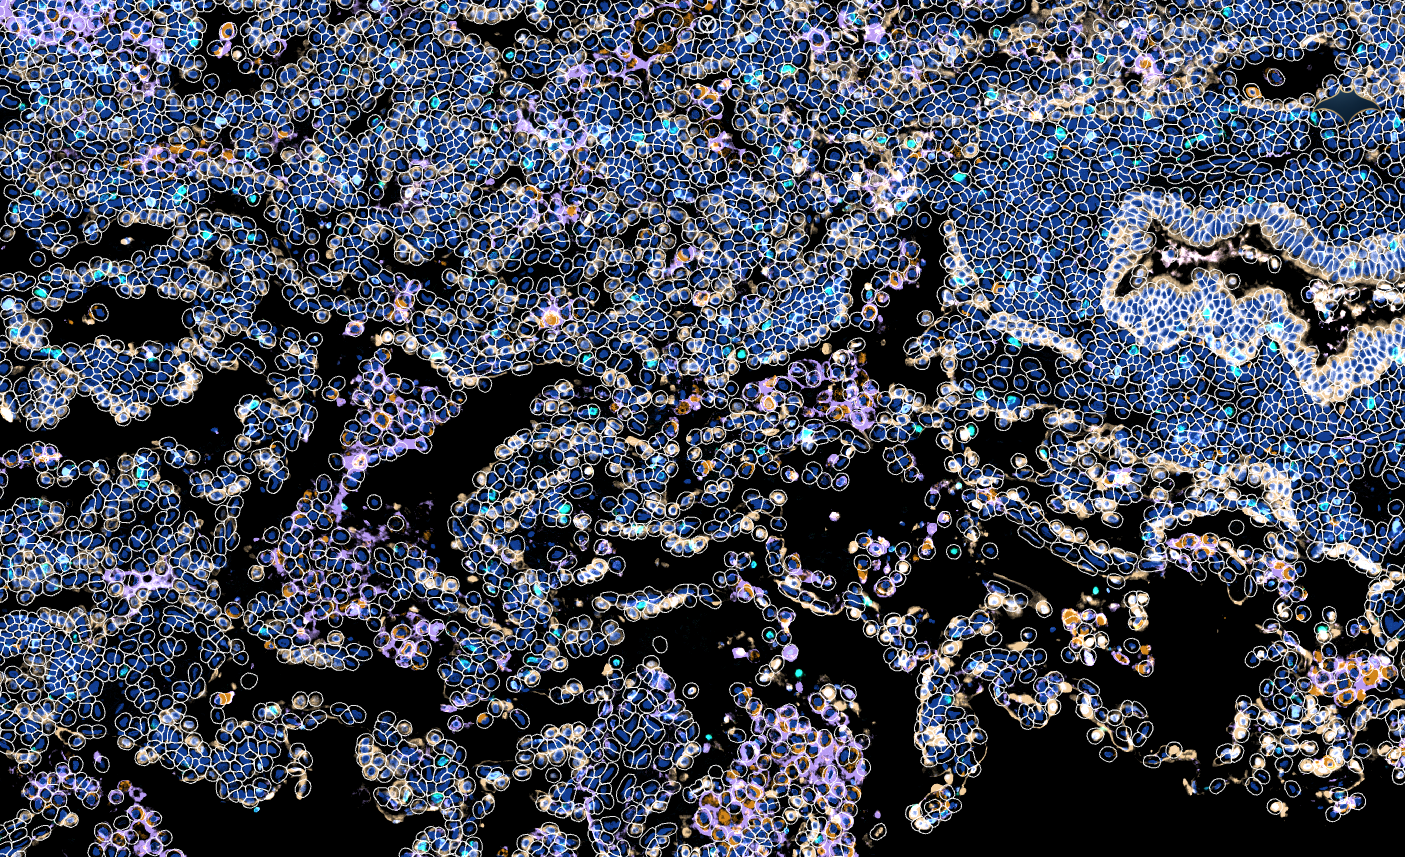
Single-Cell Phenotyping
Robust and reproducible insights at the single-cell level
- Navigate single-cell analysis with ease and precision using our intuitive guided workflow
- Customize your analysis parameters to achieve optimal segmentation, clustering, and classification results
- Utilize unsupervised clustering and rules-based classification to accurately and reproducibly identify cell populations according to a user-defined hierarchy
- Visualize and validate your results at each stage of analysis, overlaid directly on your tissue
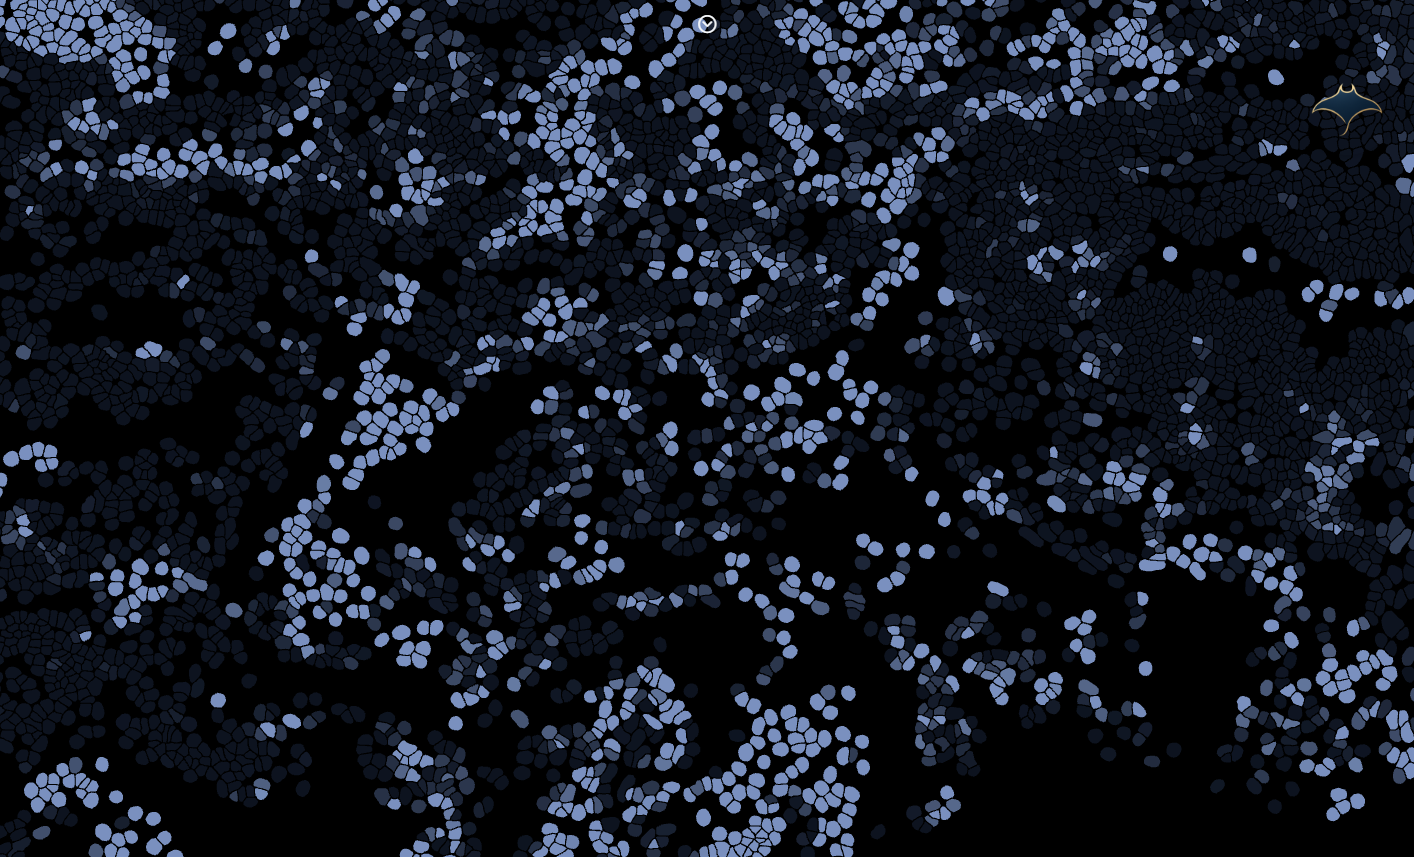
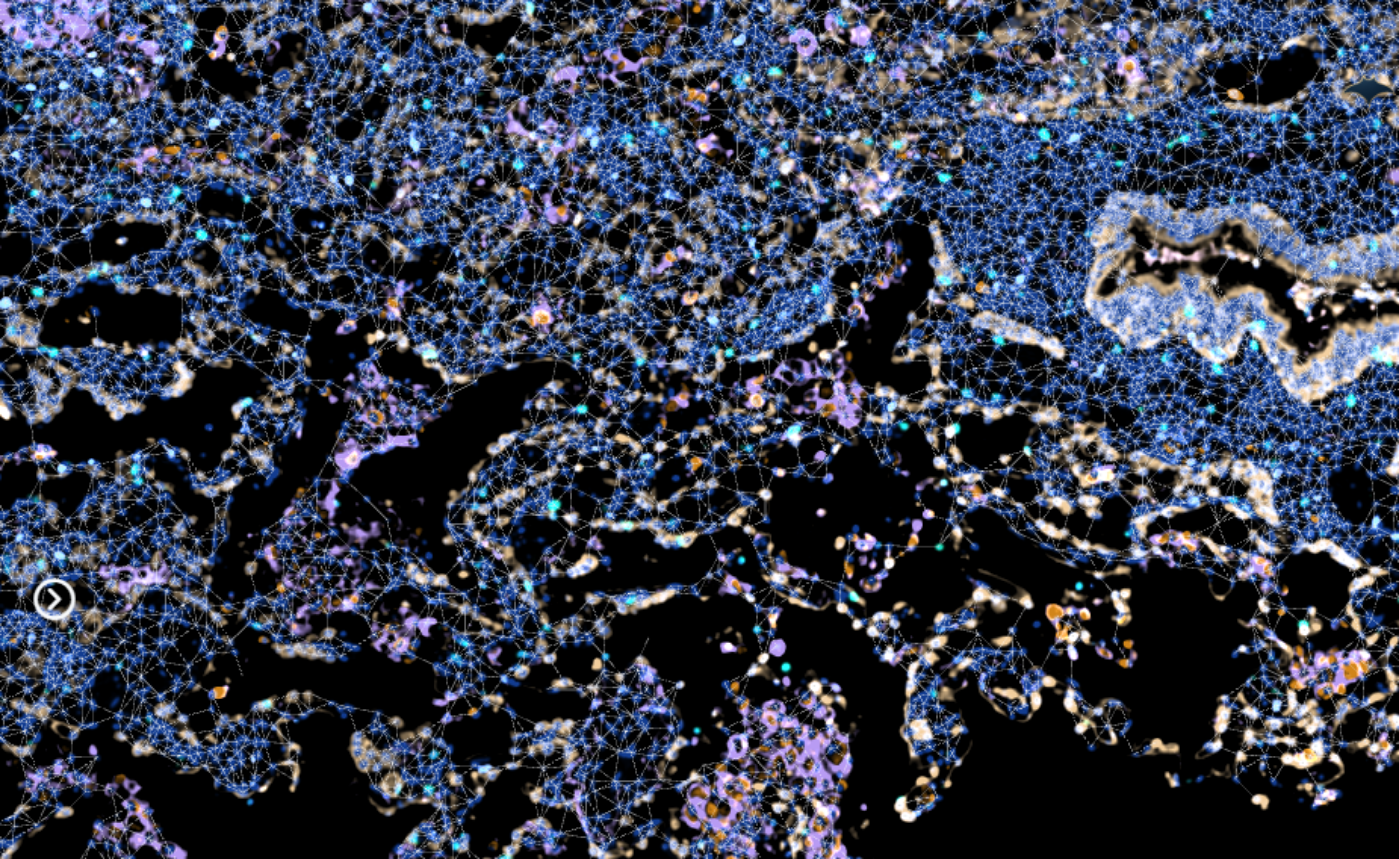
Spatial Analysis
Cell-to-cell interactions within a complex tissue microenvironment
- Perform proximity profiling to identify neighboring populations around your target cells
- Execute nearest-neighbor analyses to quantify distances between interacting populations
- Utilize automated detection of cellular clusters to identify neighborhoods of interest in a reproducible, unbiased manner
Results & Export
- Visualize single-cell and spatial analysis results in real time using interactive graphs
- Explore hierarchical data using interactive sunburst plots
- Export your variables of interest in a customizable single-cell feature table (.xls and .csv)
How to use MantaPlexTM
Step-by-step tutorials to get the most out of our software
What you'll learn
- Introduction to MantaPlex™
- Platform overview
- Getting started guide
- Key concepts and features


Our
Pricing
Check out our online form for a pricing estimation. For an official quote, please contact us directly.
Contact usWhat do you need ?